It is relatively easy to slip into the belief that the Scottish labour market has performed as well as the rest of the UK since the beginning of the Great Recession in 2008. Scotland’s unemployment rate, like that in the rest of the UK, is close to its pre-recession level of around 5% (see Figure 1). By international, and particularly European, standards, this is a very low rate.
Figure 1: Unemployment Rates in Scotland and the UK 2008-2015

And employment in Scotland attained an all-time record in 2014, with 2.63 million Scots in jobs, an increase of 3.1% on its level at the beginning of the recession. Scotland’s employment rate is 59.6%, a fraction lower than it was at the start of 2008, but still close to the overall UK rate of 60.1%.
So why might one conclude that Scotland’s labour market performance is significantly weaker than that in the rest of the UK? The argument starts with a piece of analysis recently carried out by the Laura Gardiner of the Resolution Foundation. She showed that, at the start of the recession in 2008, there was a substantial loss of male and female full-time jobs in the UK as a whole. As the recovery got underway, these losses were partly offset by increased self-employment and part-time working: full-time work was offset by other forms of employment. However since 2013, there has also been a strong recovery of full-time work, both for males and females. So the British labour market has changed significantly since the recession with strong growth in self-employment and also in part-time working. But there are also has been a recovery in full-time jobs: their level is now 3.6% higher than at the beginning of 2008. Overall employment is 5.7% higher.
Did Scotland follow the same pattern? Analysis of the Labour Force Survey shows that it did not. This can be judged by comparing Figures 2 and 3. Figure 2 shows follows changes in the composition of UK employment as a whole since the beginning of the recession. It thus replicates the Resolution Foundation analysis without any gender breakdown. Figure 3 shows the same analysis for Scotland. The results are based on the individual data from the Labour Force Survey.
Figure 2 UK: Change in Employment since 2008
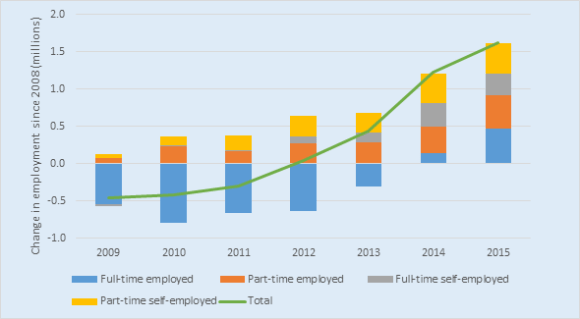
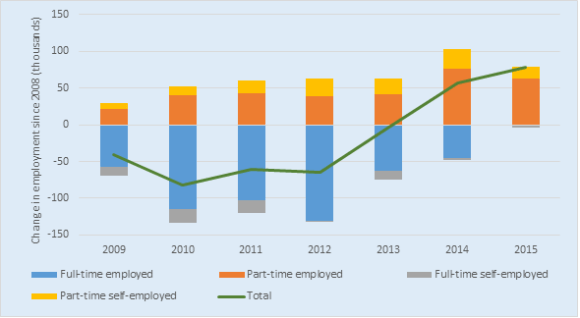
Figure 3 Scotland: Change in Employment since 2008
In both figures, the solid green line shows the overall change in employment, while the bars show the increases or decreases in different forms of employment which added together equate to this overall change. Thus, in Figure 2, the period 2009 to 2012 is dominated by reductions in full time employment. In 2013, although full-time employment was still below its previous peak, strong growth in self-employment and part-time employment sent overall employment onto an upward trend. By 2015, in the UK as a whole, all forms of employment were substantially above pre-recession levels.
Compare this with the changes that took place in Scotland over the same period, as shown in Figure 3. Loss of full-time jobs was a consistent drag on overall employment, only just returning to its 2008 levels in the first three quarters of 2015 (data from the LFS are only currently available up to 2015 Quarter 3).
It is immediately evident that Scotland lags well behind the rest of the UK in the recovery of total hours worked. Indeed, even the latest data show Scotland still not having recovered its pre-recession hours worked. In contrast, hours worked in the UK is more than 4 per cent above its pre-recession level, which it surpassed during 2013.
How can this reduction in hours worked in Scotland be consistent with an overall increase in employment? The answer must be that average hours per job has fallen more than the number of jobs themselves has increased. As mentioned above, the shift towards part-time work reduces the average number of hours per job. But this must also be accompanied by a reduction in the average number of hours in part-time and/or full-time jobs. This can come about, for example, by reductions in shifts worked or in overtime. Whatever, the explanation, the implication from Figure 4 is clear: through the metric of hours worked, Scotland has not yet recovered from the 2008 recession, whereas recovery of hours worked in the UK as a whole now looks robust.
Figure 4: Total Hours Worked Scotland and UK 2008-2015: 2008Q1 = 100

Clearly, this analysis begs a number of further questions, such as why are employers in Scotland less willing to commit to full-time employment than in the rest of the UK? Why has the growth in self-employment in Scotland not kept pace with the rest of the UK? What has happened to hours worked per job in Scotland?
Answers to these questions must wait further analysis, but this preliminary work has established a clear conclusion that the performance of the Scottish labour market since the beginning of the recession has been significantly weaker than that of the UK as a whole and that this weakness is associated with changes in the composition of employment and in average hours worked per job. Focussing on the aggregate level of employment and the unemployment rate do not tell the whole story.
